2 min readPlaceholder
Building Dashboards That Drive Decisions
- Analytics / BI
- Leadership
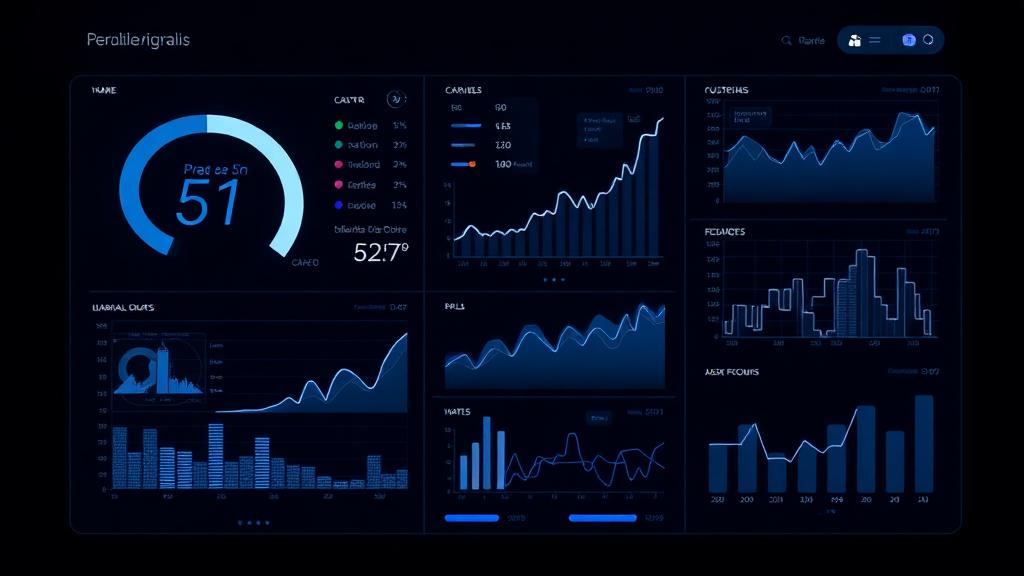
This entry is a placeholder. It holds the page's layout while the real article is written.
The Problem with Most Dashboards
I've seen this pattern dozens of times: a stakeholder asks for a dashboard, a team builds it, everyone celebrates the launch, and within two weeks it's forgotten. The data is there, but nobody's using it to make decisions.
Start with the Decision, Not the Data
The single most important question I ask before building any dashboard: "What decision will this help you make?"
If the answer is vague - "I just want to see the numbers" - that's a red flag. Good dashboards are built around specific decisions:
- Should we increase spend on this channel?
- Which region needs intervention this quarter?
- Are we on track to hit our revenue target?
Design Principles I Follow
1. Lead with the answer
The most important metric or insight should be visible in the first 3 seconds. No scrolling, no clicking, no filtering required.
2. Reduce cognitive load
Every additional chart, filter, or color is a decision the user has to make. Be ruthless about what you include.
3. Build for the weekly rhythm
Most business decisions happen on a weekly or monthly cadence. Design your dashboard around that rhythm.
-- Example: Weekly trend query that powers a simple KPI card
SELECT
  DATE_TRUNC('week', created_at) AS week,
  COUNT(*) AS total_orders,
  SUM(revenue) AS total_revenue,
  ROUND(AVG(revenue), 2) AS avg_order_value
FROM orders
WHERE created_at >= CURRENT_DATE - INTERVAL '12 weeks'
GROUP BY 1
ORDER BY 1;
The Takeaway
Build dashboards that answer questions, not dashboards that display data. The difference is subtle but everything.
Related Posts
SQL Patterns I Use Every Week1 min read
Lessons from Leading an Analytics Team1 min read
The Systems Behind Good Decisions1 min read